
Quick Reference Guide
Mapline Data: From Any Dataset
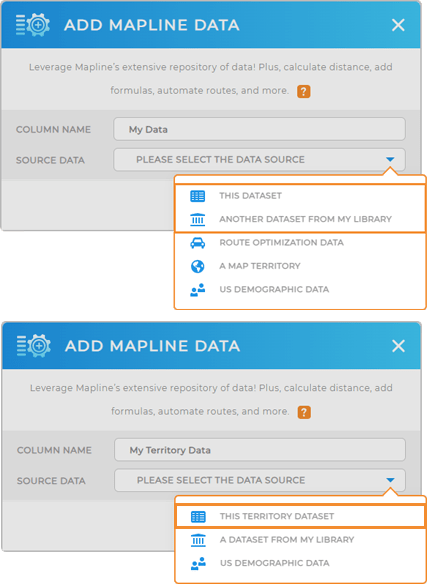
SELECT SOURCE DATA
First, select the data you want to work with.
THIS DATASET: Run formulas and cacluations within your current dataset.
ANOTHER DATASET: Run calculations using the data in another dataset, and add the resulting answers as a new column in this dataset.
TERRITORY DATASET: Leverage the data contained in an individual territory to calculate location-specific data.
This not only determines which data you’re pulling from, but also which types of calculations you’ll be able to run. For example, when working within your existing dataset, you’ll have quite a few more options than when you’re working between datasets.
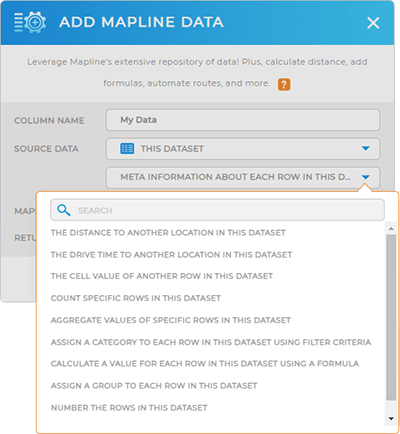
Next, use the drop-down menu to select the type of calculation you need.
Let’s dive in to which options are available and how each one impacts your data insights.
DETERMINE CALCULATION TYPE
Buckle up, because your mind is about to be blown!
The calculations at your fingertips are your Mapline superpower! You can literally uncover anything you want to know about your business and operations with these formulas.
You even have access to several types of formulas that don’t exist in Excel! And the best part? All you have to do is select the right options–Mapline does the rest for you.
Let’s dive in to which options are available and how each one impacts your data insights.
DISTANCE TO ANOTHER LOCATION IN THIS DATASET
Imagine you’re managing a fleet of vehicles for deliveries and you need to calculate the driving distance between the distribution center and each store location in your dataset.
Mapline Data makes it easy to find the straight-line or driving distance between two locations in your dataset.
Straight-line distance is the shortest path between two points on a map.
Driving distance calculates the distance based on real-world routes.
Use this calculation to optimize logistics, estimate travel times, estimate fuel costs, or minimize time spent on the road.
DRIVE TIME TO ANOTHER LOCATION IN THIS DATASET
Let’s say you have sales reps visiting clients on-site. Knowing the exact drive time to each client’s location is a real game-changer when it comes to client rapport and scheduling precision.
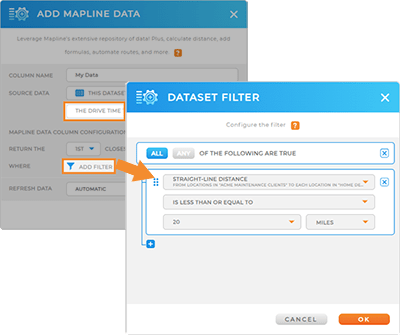
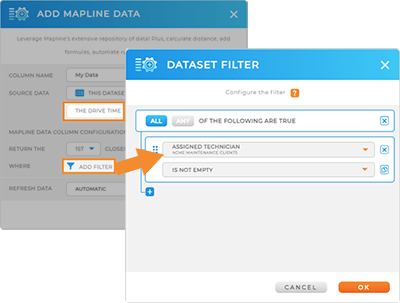
Here’s how to find the drive time between two locations in your dataset.
Mapline defaults to calculating the drive time to the closest location in your dataset, but you can easily choose any location by clicking the drop-down menu.
Next, configure your filter to return only the information you need.
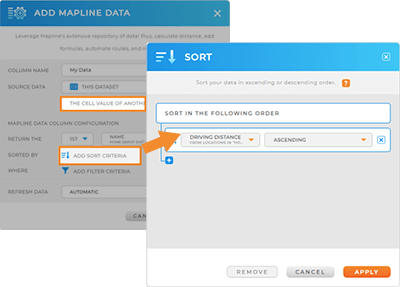
CELL VALUE OF ANOTHER ROW IN THIS DATASET
Maybe you need to review specific KPIs, such as sales figures or customer visits. Mapline data makes it simple to pull relevant figures from the columns in this dataset and get straight to the analysis.
This feature allows you to use information from one row to calculate something in another row. Just determine which type of count you want to see, apply any relevant filters, then sit back and watch. You can choose from the following options:
COUNT: Calculates how many times something specific appears in your dataset.
COUNT OF UNIQUE VALUES: Tallies how many different kinds of things are in your dataset, ignoring any repetition of the same thing.
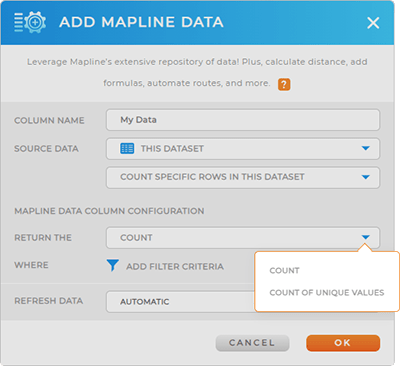
COUNT SPECIFIC ROWS IN THIS DATASET
Get the number of specific rows or unique values in your dataset. This calculation helps you understand occurrences, patterns, and the overall distribution of data.
COUNT: This calculates the total number of rows within a dataset that meet a specific condition or criteria. It provides a quantitative count of occurrences that satisfy the given parameters within the dataset.
COUNT OF UNIQUE VALUES: This calculates the number of distinct or unique values in a specific column or field within a dataset. It disregards duplicate entries and provides a count of only the different, non-repetitive values present in that particular dataset column or field.
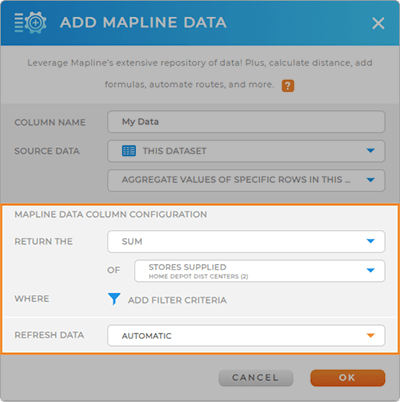
AGGREGATE VALUES OF SPECIFIC ROWS IN THIS DATASET
Let’s say you need to assess your sales team’s performance by territory. Aggregating values can help you track specific KPIs, such as sales, customer visits, or average purchace amounts.
With this function, you can combine values from different rows to calculate sums, averages, medians, maximums, minimums, or unique values.
You may want to see the sum of sales in a given territory, or find the average amount of time your sales reps spend visiting clients.
These types of calculation helps you summarize and analyze data across multiple rows, providing a clearer picture of your data.
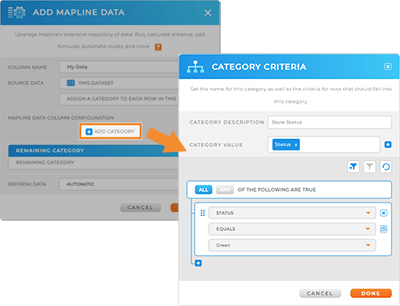
ASSIGN A CATEGORY TO EACH ROW IN THIS DATASET USING FILTER CRITERIA
Sometimes, it’s helpful to categorize your data so you can see what you need as quickly as possible.
Maybe you want every locaiton in your dataset to belong to a region, like North, South, East, or West. Or, maybe you need to categorize your technicians by the type of work they do so you can streamline your scheduling.
Quickly organize your dataset by assigning categories based on specific conditions. Group and sort your data to gain better insights and make smarter decisions.
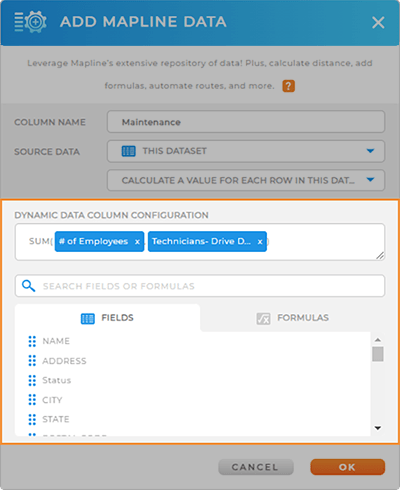
CALCULATE A VALUE FOR EACH ROW IN THIS DATASET USING A FORMULA
Use custom formulas or equations to calculate values for each row in your dataset. This powerful feature allows you to perform complex calculations effortlessly, unlocking the full potential of your data.
For example, maybe you want to calculate the ROI for each of your stores. You might run a formula such as SUM (SALES – OPERATIONAL COSTS).
To apply a formula, toggle between the FIELDS and FORMULAS tabs and click and drag the elements you need to write your own custom formulas. Use the search bar to quickly find what you need.
When you’re done, click OK, and the results will appear as a new column in your dataset. How incredible is that?
ASSIGN A GROUP TO EACH ROW IN THIS DATASET
Group cells in your dataset based on assigned categories. Organize and visualize your data by creating clusters or groups, enabling easier analysis of specific subsets.
Maybe you want to group customers based on demographics, purchase history, or other relevant criteria.
You could even use grouping to compare and analyze performance by grouping similar data points for meaningful insights.
Let’s dive into the two different methods for grouping your data.
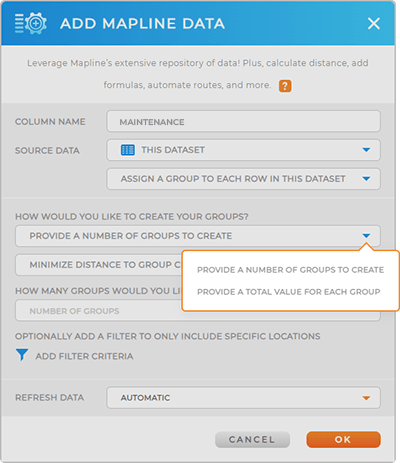
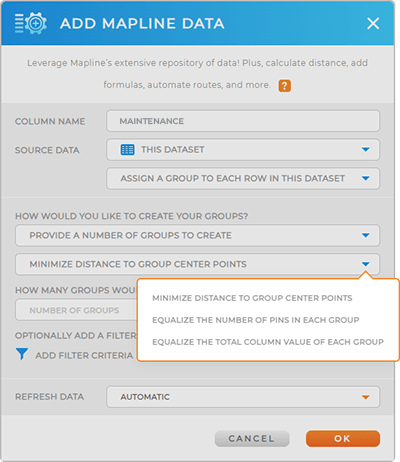
PROVIDE A NUMBER OF GROUPS TO CREATE
Here, you can manually type in the number of groups you’d like to create in your dataset.
Just determine which option you prefer:
- MINIMIZE DISTANCE TO GROUP CENTER POINTS: Organize groups to reduce the overall distance between the locations and their respective center points, making them more centrally located.
- EQUALIZE THE NUMBER OF PINS IN EACH GROUP: Form groups with a similar number of locations for a balanced distribution.
- EQUALIZE THE TOTAL COLUMN VALUE OF EACH GROUP: Ensure that each group has a similar combined value in a selected column for balanced comparisons.
Next, type the number of groups you’d like to create, and add any relevant filter criteria. Finally, determine whether you want your data to refresh automatically, or if you prefer to keep this process manual.
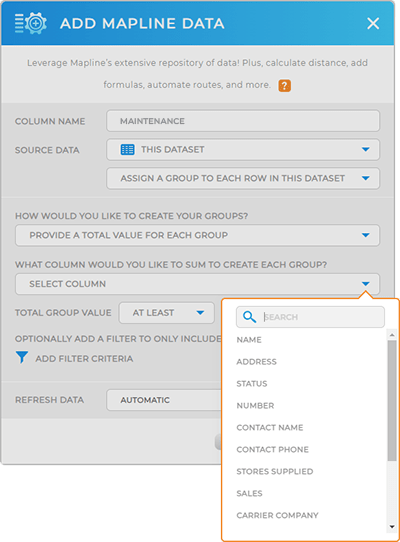
PROVIDE A TOTAL VALUE FOR EACH GROUP
Automatically create groups based on the sum of one of your dataset columns. For example, maybe you want the sum of sales for stores that make at least $10,000/ year.
Just select the dataset column you’d like to base your groups on. This should be a numeric column since you’ll be taking the sum.
Next, determine which calculation you need:
- AT LEAST: Calculates values meeting or exceeding a minimum threshold.
- AT MOST: Calculates values at or below a maximum limit.
Finally, add anly relevant filters and decide if you want your data to update automatically manually. When you’re done, click OK.
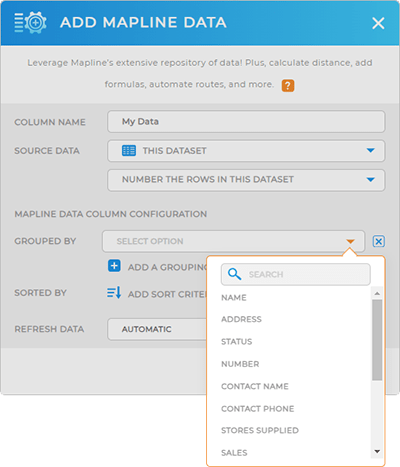
NUMBER THE ROWS IN THIS DATASET
Automatically assign unique numbers to each row in your dataset. This calculation provides a simple way to identify and refer to specific data points, keeping your information organized and accessible.
It sounds simple, but it can be a real game-changer for staying organized.
By numbering each row, you’ll effortlessly keep track of every entry, making it a breeze to navigate and analyze your data. Simply select the dataset column you’d like to number, add any relevant grouping or sorting criteria, then determine whether you want this calculation to update automatically or manually. Click OK and voila! Your dataset is now neatly numbereed, ready for easy reference and analysis.
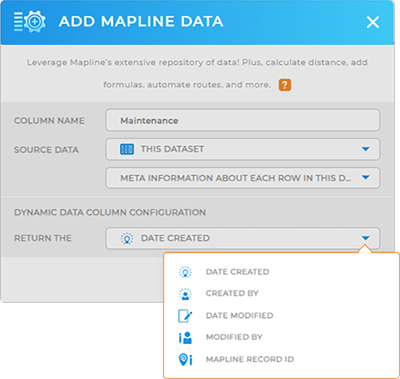
META INFORMATION ABOUT EACH ROW IN THIS DATASET
Access additional information about each row in your dataset, such as creation and modification dates, creator name, or the Mapline record ID. Maintain data accuracy and integrity with a clear audit trail of each row’s history and origin.
It’s like having a personal assistant keeping track of your data’s history, making sure you always have the most accurate and up-to-date information at your fingertips. Just select the type of meta information you need, click OK and you’re all set.
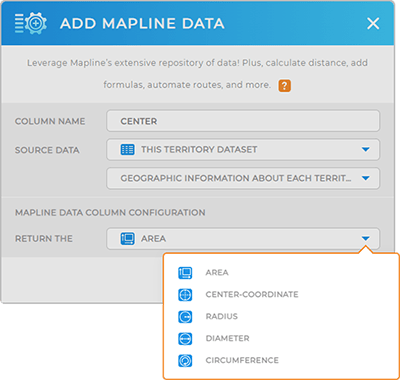
GEOGRAPHIC INFORMATION ABOUT EACH TERRITORY
If you’re working within a territory dataset, this powerful formula allows you to calculate geographic information within a given area. This is a great way to level up your business analytics and discover location-relevant insights about your operations.
Choose from the following types of territory calculations:
AREA: Measures the total space inside a territory.
CENTER-COORDINATE: The exact middle point of a territory.
RADIUS: How far it is from the edge of a territory to the center of a territory.
DIAMETER: The total width of a territory, measured from ione side to the other through teh center.
CIRCUMFERENCE: The total length of a territory’s border.
And BAM! Now you have insight into how distance impacts operations within your territorires.
Pro Tip: Center-coordinate yields the center of minimum distance within a territory, not the midpoint. The center of minimum distance optimizes overall distance and typically gives a more accurate representation of the center of a territory–whereas the midpoint is not always an accurate representation of the geometric center of the shape.