Quick Reference Guide
Mapline Data: U.S. Demographic Data
CONFIGURE YOUR COLUMNS
Now, take the reins and configure your calculations to generate the precise data you need. These configurations empower you to fine-tune everything to align perfectly with your needs.
Here’s how to effortlessly shape your datasets to include the most insightful demographic data and custom-tailored brand insights.
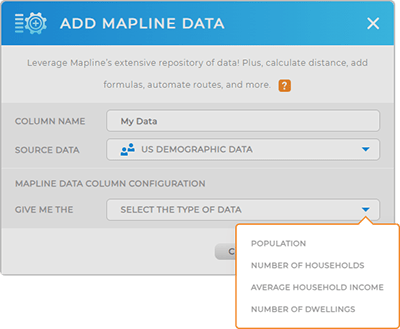
POPULATION
Calculate the total number of individuals living in a specific geographic area. This is a fantastic way to get insight into the size and density of a population within a given region.
Plus, drill down even further and get insight into specific metrics, including voting age, ethnicity, and race.
Note: Population data is based on data gathered by the U.S. government. Mapline does not discriminate based on any individual’s race or ethnicity; these metrics are provided strictly for business purposes.

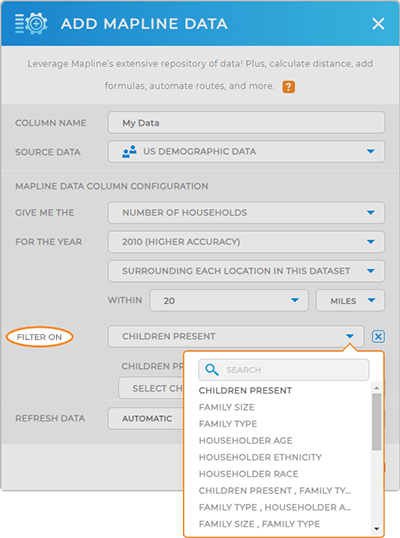
NUMBER OF HOUSEHOLDS
Calculate the total number of separate living spaces of families within a designated area. This information gives a clear picture of how households are spread out in different locations.
Add Filters to get even deeper insights, including:
- Children present in the home
- Family size
- Family type
- Householder age
- Householder ethnicity
- Householder race
What a powerful way to uncover exactly where your ideal customers are!
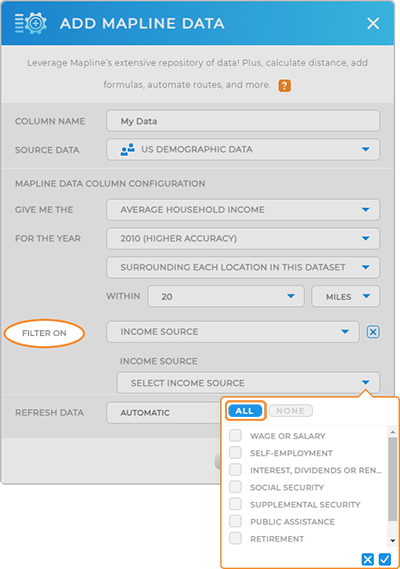
AVERAGE HOUSEHOLD INCOME
Get insight into where your ideal customers live by adding average household income to your datasets and maps. There’s never been an easier way to identify and visualize where to find your target audience!
Plus, leverage the same filters that exist under number of households (listed in the section above).
You can even filter by householder age or income source, giving you even deeper insight into your target audience.
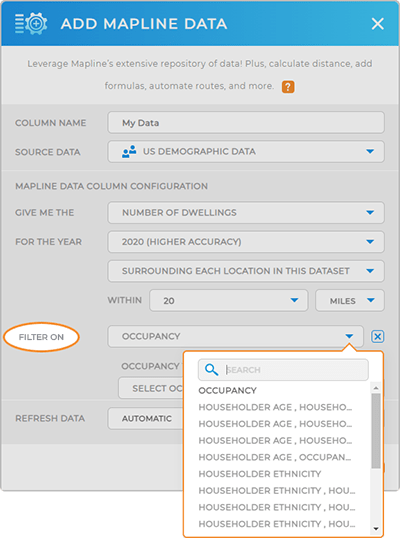
NUMBER OF DWELLINGS
This is an extremely useful metric, particularly if your brand revolves around on-site household services. Quickly get insight into how many occupied or vacant dwellings exist in a given area and uncover the best areas to do business.
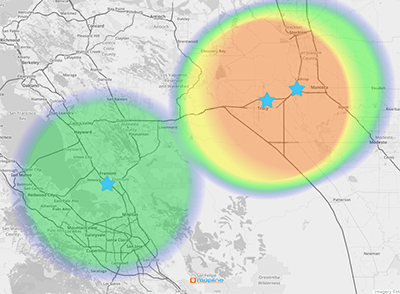
LEVERAGE YOUR NEW DATA
Once you add this data to your dataset(s), you can easily visualize it on your maps! View data within your map territories, create heat maps to visualize customer density, or create custom territories to identify where you should focus your efforts.
How convenient is that?