
Mapline’s V5 Update
The biggest changes are here, and they’re taking the mapping experience to a whole new level! Since it’s Mapline’s goal to exceed the expectations of our users, here are the changes that we designed and developed over the past few months to bring you the best mapping experience in the most time-efficient ways.
User Interface
The first thing you’ll notice is that most of the features are now more accessible. This is because we have consolidated everything that can be added on a map into just one button. The “Add” Button menu includes adding pins, dataset pins, shapes, and boundaries. So if you are going to use these features, this is where you’ll go. What makes it even easier to use is the right click functionality for quick menu access once you’ve add them to the map.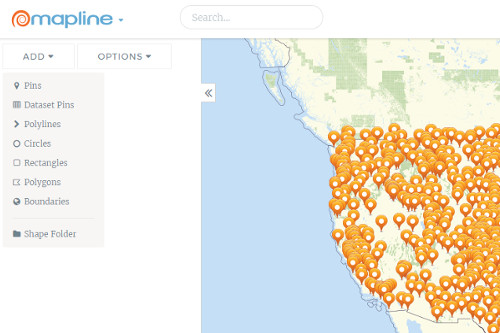
Shapes (Including Boundaries)
One of the most prominent changes that we’ve made has to do with our custom drawn shapes. We’ve made it so much easier for you to draw polygons, polylines, circles, or rectangles on your map. They are also editable; you can name the shapes, hide them, or delete them in just a few clicks. This feature can also be found in “Add” button.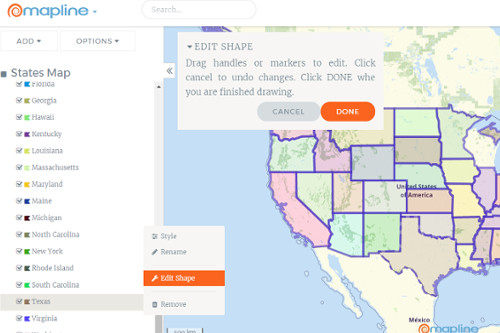
Pins
Want to add pins directly on your map? With these changes comes the option of adding pins on your map at the click of a mouse! It’s that easy! Just click your mouse wherever you want to drop your added pins.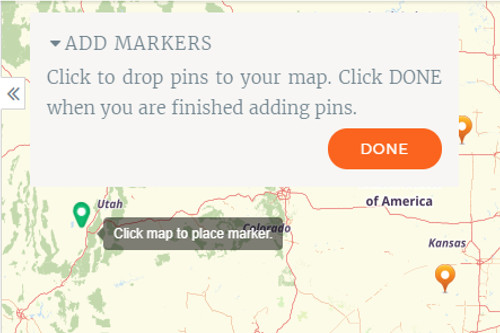
Styling
Changing the way your map pin looks like is now more exciting with the Styling option. The “Styling” tab allows you to change the color, shape, stamp, and size of your pins. You can add custom images as your map pin.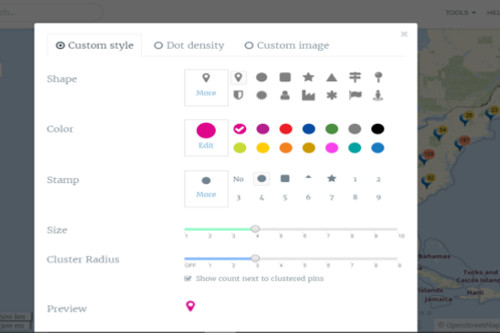
Filter
Filtering the pins is now made more powerful. Your map pins can now be filtered with different criteria. The Filter Option allows you to choose a category to filter. Not only that, it now allows you to choose the criteria (equals, does not equal, contain, does not contain), add calculation, and use the AND and OR functionalities.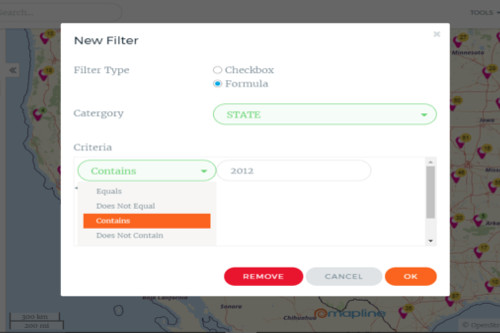
Other Features
We have also moved and upgraded a few more things. Here are some other changes:- The “Tools” Menu is now located on the top right corner of the screen.
- The “Tools” Menu includes the Excel Add-in and Distance Calculator.
- If you want to export a map, click “Save Image As.”
- The “Menu” button is now called “Options.”
- The zoom buttons can now be found on the right side of the map.
- Looking for “Sublayers”? Click “Segments” and you will notice improved functionalities.