How to Get Started with Mapline
Learn the basics and convert your spreadsheet into a map of locations.
With more and more tools being added to Mapline, it can be difficult to know where to start. This video will take you through the basics of creating a map and uploading an Excel spreadsheet (or any other spreadsheet) to your map or follow along with the instructions below. Get introduced to the Mapline interface and start learning how to take your data to a whole new level with Geospatial mapping.
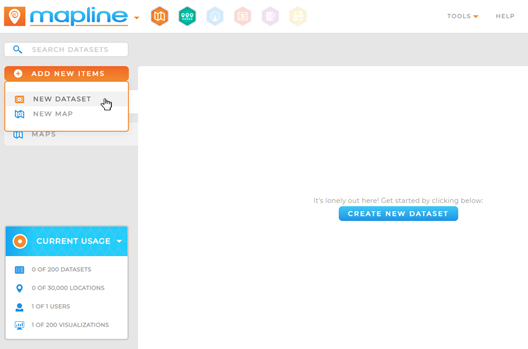
1. CLICK “ADD NEW ITEMS”
Click the “Add New Items” button on the home page, and select the “New Dataset” option. You can also click the Mapline logo, and select “New Dataset” to get there too. If you’re looking to create a dataset from a map page, then you will want to select “Add,” “Pins,” then “From Spreadsheet.”

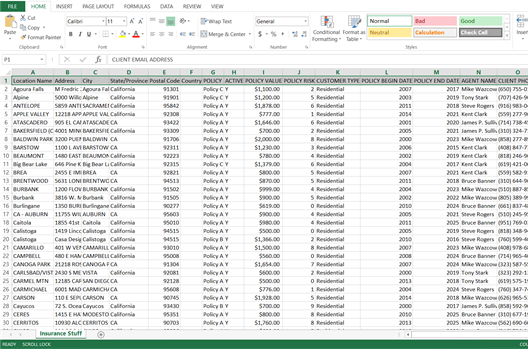
2. FORMAT SPREADSHEET DATA
Make sure your spreadsheet is using the correct format by checking your headers. You need to have at least one column with address-type information (Address, City, State, Postal Code, Country, or Lat/Long Coordinates). If you use lat/long coordinates, they need to be separated into different columns. You aren’t limited to the number of columns you can upload, so include all the info that you’ll need to see.

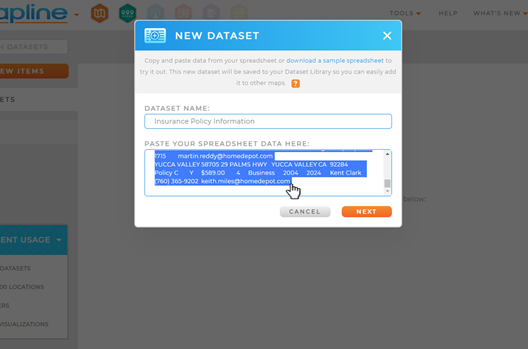
3. NAME DATASET AND PASTE IN DATA
Once your data is formatted, copy the headers and all the rows that you want to upload. Then give your dataset a name, paste the data into the box, and click “Next.”

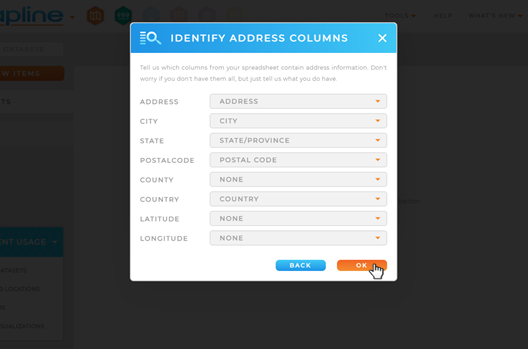
4. VERIFY HEADERS AND CLICK “OK”
In order to make sure that your data will plot correctly be sure to verify your address columns. This will let you make sure that we’re is recognizing all of your columns correctly. Clicking “OK” will create your dataset. If you get an error message, make sure that you included your headers when you copied and pasted in your data.

5. Add the dataset to a visualization
To add the dataset to a visualization, select the “Dependencies” option from the tool bar. Then select “Add To” to see a list of visualizations that you can create from your dataset.


